The below Refunds & Credit Notes Related Reports are available (the location where each Report can be found has been listed below next to the report name):
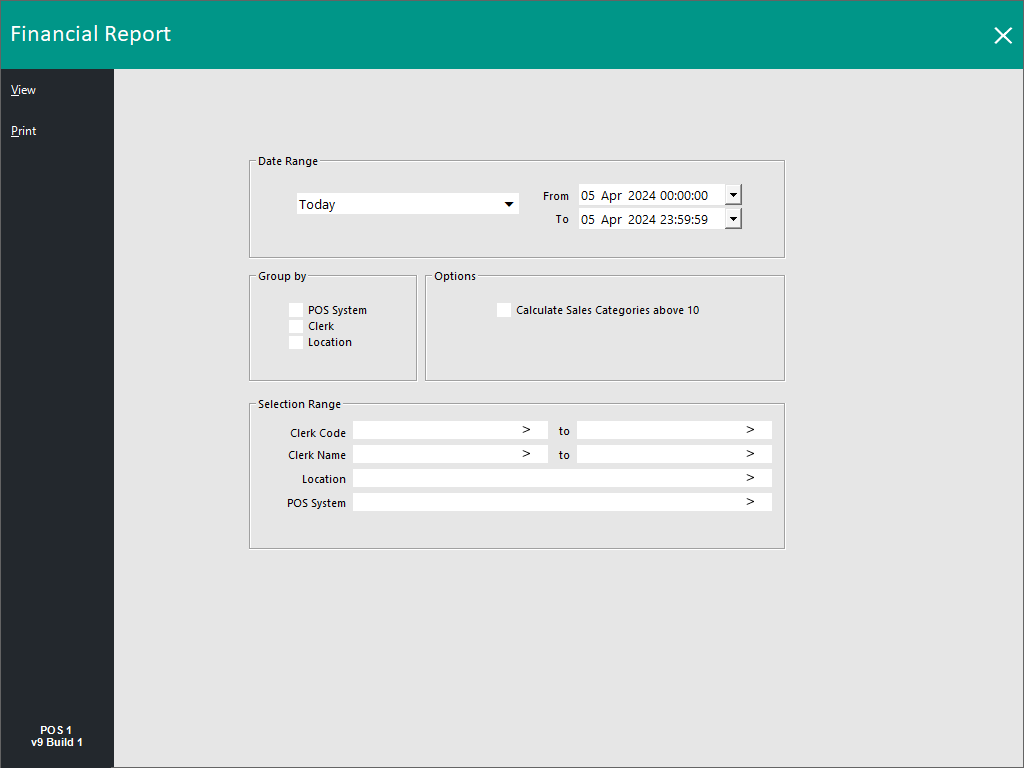
This report will allow you to use the following options:
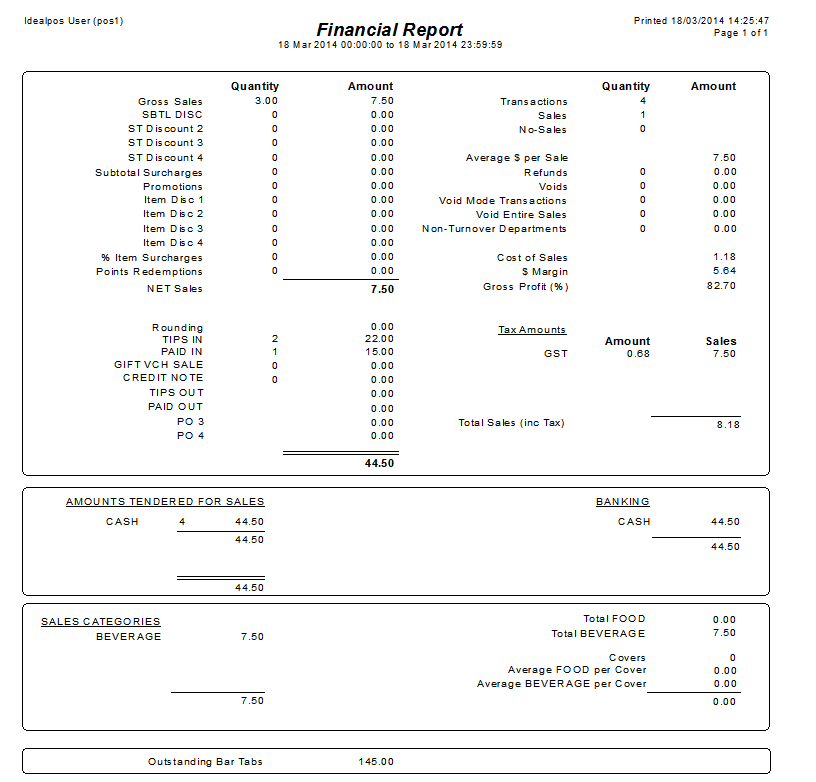
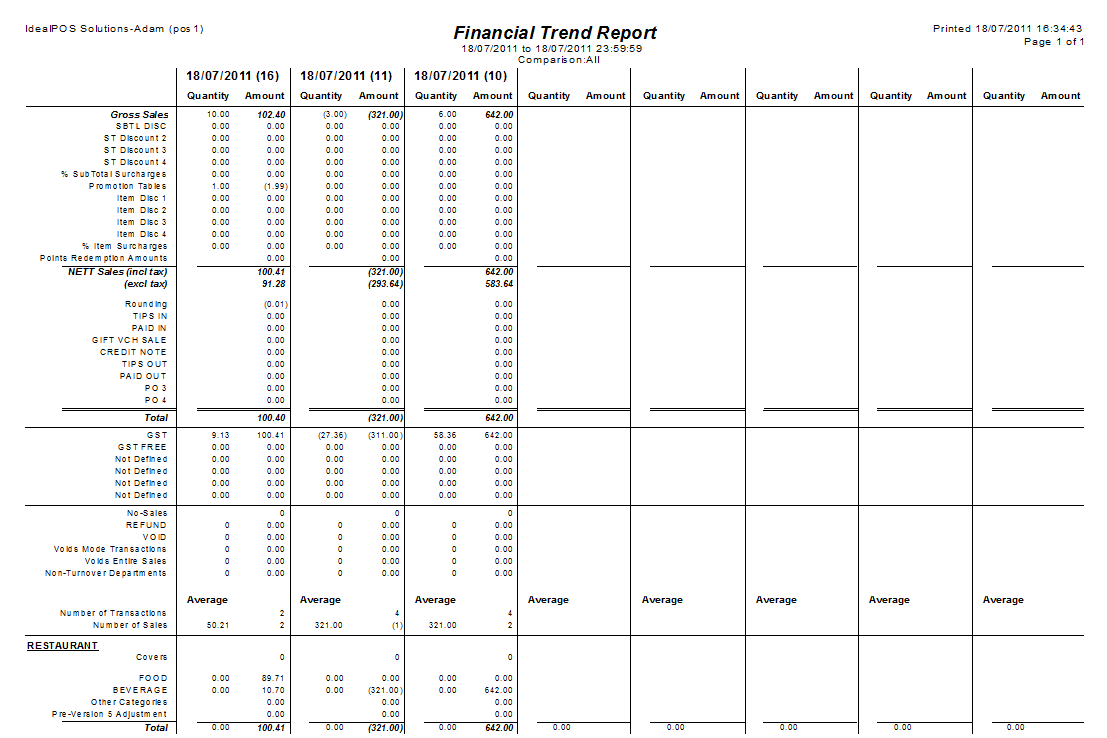
This report will display all financial information of the specific functions used for the duration of the selected date range, and will detail the totals for each function that has been recorded through the POS Screen.
This report will not display any amounts that have been entered as a Cash Declaration.
Total Sales (Inc Tax) amount will only display on terminals using the Canada/USA Regional setting.
This report will allow you to use the following options:
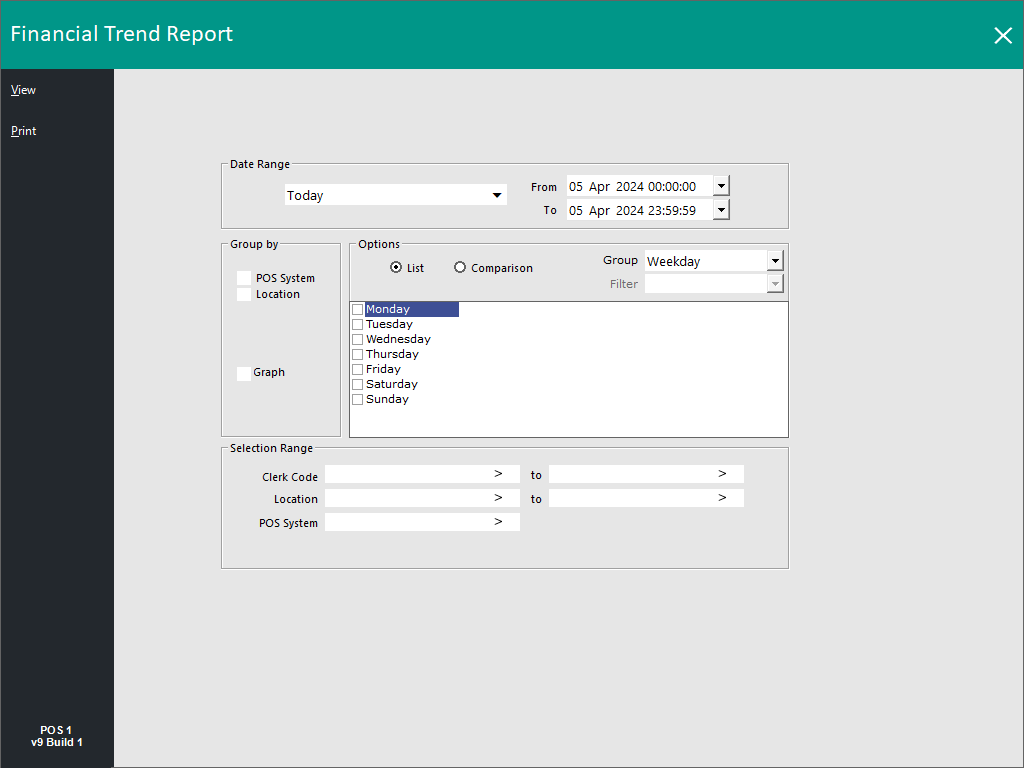
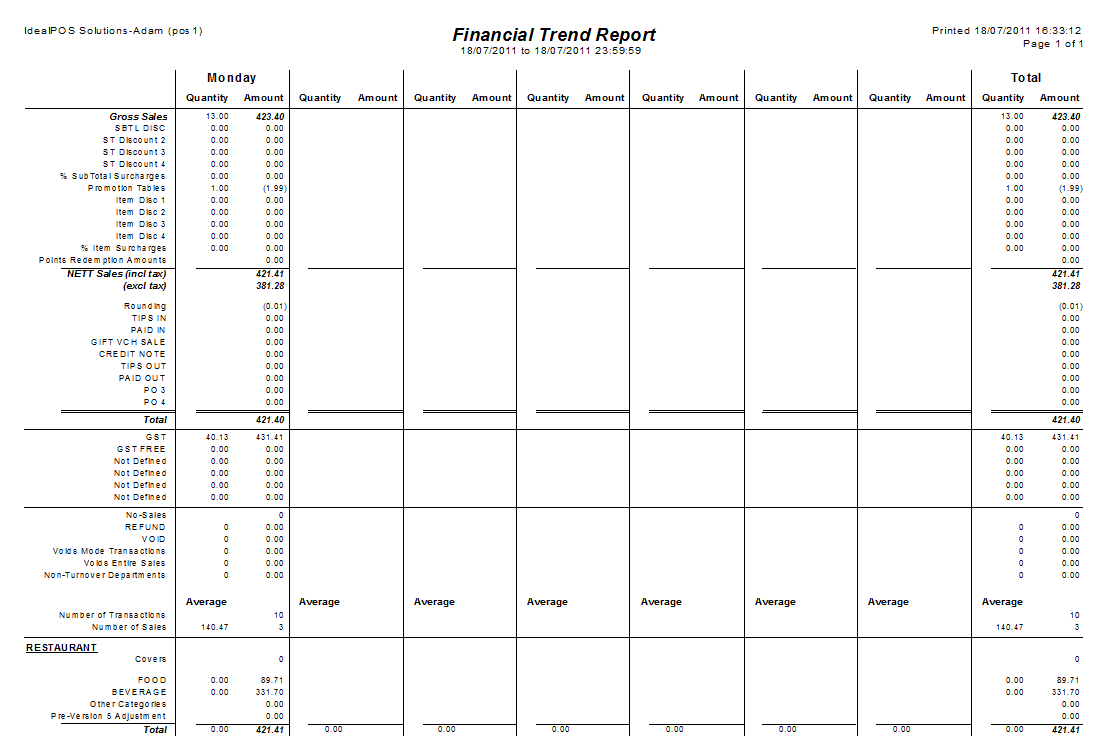
This report will allow you to see the “trend” of the selected range for the financial functions over a spread of data selections.
You are able to see at a glance figures that stand out as incorrect or need attending.
This report will give you the following options:

This report will show the Credit Note details dependent on the options selected.

This report will detail the quantities of each selected Stock Item within the range.
This report will give you the following options:
The Stock Item Sales Report is the first report in Idealpos to have MDI (Multiple Document Interface) functionality enabled.
This functionality enables report window to be resized using the resize button (top-right corner of the report window), which in turn enables additional reports to be run concurrently as well as the ability to access other Back Office functions at the same time that the report is being displayed.
Tip!
The Selection Range in Stock Item Sales includes support for Fast Lookup Textboxes.
Fast Lookup Textboxes enable a fast lookup to be performed in any of the fields shown in the Selection Range by simply entering either a numeric or text value.
As the value is entered, any records that match the value that has been entered so far will be displayed in a list and you may select the required option by either clicking on it or using your keyboard's arrow keys, then selecting the entry by pressing Tab or Enter.
This function allows records to be looked up either by their numerical value or description value, regardless of whether the field requires a Code or Description.
Once you select the required entry from the list, either the description or code will be entered into the field, depending on the field type.
E.g. When performing a lookup in a Code field, a Stock Item code can be entered into the Code field to display a list of items that contain or match the entered code.
A Stock Item Description can also be entered into the Code field and any items which match the entered description will be displayed.
Once an item is selected, its Code will be entered into the Code field, regardless of whether it was searched using the Description or Code.


This report will show the breakdown of sales by Stock Item.
The Unit Price Inc column is always inclusive, including regions which sell items with Ex Tax Rates (i.e. Tax is applied or added to the item during the finalisation of the sale).
This report is useful for viewing the total quantities of a particular item or items within a specific department when trying to achieve sales goals.


The Stock Item Sales Report supports MDI functionality.
When running a report, the top-right corner of the report window will display a resize button (on higher screen resolutions such as 1920x1080 that support this functionality).
The button will be hidden on lower screen resolutions that don't support this functionality (such as 1024x768).
The resize button can be pressed to resize the report from full screen to a window.
This enables multiple reports to be run concurrently and displayed side-by-side.
Other Idealpos Back Office functions and menus can also be accessed when the report is being displayed as a resized window.

The Stock Item Sales Report can be set to use the Last Cost instead of the Standard Cost via a User-Defined Option.
To enable this functionality, go to:
Back Office > Setup > POS Terminals > Select a POS Terminal > Modify > POS Settings tab.
Create the following User-Defined Option:
Description: STOCKSALESREPORT-LASTCOST
Setting: 1

Close the POS Terminals window to save the change.
To demonstrate this function, the Idealpos Demo Database contains a "MICROWAVE" Stock Item with a Stock Item Code 303004.
The Stock Item's Standard Cost has been set to 71.2000 and the Last Cost has been set to 61.2000.

Select the "Cost of Sales" option within the Sort Order section when running the Stock Item Sales Report.

When the Stock Item has been sold and the User-Defined Option "STOCKSALESREPORT-LASTCOST" is set as 1, the Last Cost of 61.2000 will be displayed on the report.

When the Stock Item has been sold and the User-Defined Option "STOCKSALESREPORT-LASTCOST" is set as 0 (or if the User-Defined Option hasn't been created), the Standard Cost of 71.2000 will be displayed on the report.

The Top N Records function is available when using the Best/Worst options.
The Top N Records function will limit the number of records shown to the number entered in the Top N field.
When used with Grouping, the Top N Records function will show the Top N records for each group (e.g. each Department).
When used without Grouping, the Top N Records function will show the overall Top N records.
A few examples are shown below to distinguish the difference between using this function with Grouping and without Grouping.
E.g. With Department Grouping, selecting Best > Quantity > 2.
This will display two of the best Quantity records for items in each Department.


When Grouping is not used, the report will only show the overall top N of records for the Best/Worst.
E.g. Without Department Grouping, selecting Best > Quantity > 2.
This will only display two of the overall best Quantity records.

